Centroid CNC control sales, service, training and support
The Drag Diagnostic or Drag Test is a function of the Centroid CNC7, CNC10, CNC11 and CNC12 control software. It is available on all torque-mode controls, and also on velocity-mode and position-mode controls which have analog servo load feedback wired to the control unit or PLC.
Controls which support the Drag Diagnostic include:
The Drag Diagnostic is not supported on Acorn controls, because the Acorn hardware has no provision for monitoring load.
The Drag Diagnostic is not currently supported on MPU11 controls using Centroid SD-series servo drives over the LegacyAdd interface, because the LegacyAdd protocol does not receive load information from the SD drives.
The Drag Diagnostic is run from the PID Configuration screen.
In all CNC10, CNC11 and CNC12 software versions, the Drag Diagnostic is also accessible from the Utility menu:
The control will move the axis to one end of its travel; then to the other end; then back to the starting end. Movement will be at the Slow Jog speed set in the Machine Configuration → Jog Parameters table.
When the test is done, the results will be saved in a file named drag_?.out, where '?' is the axis label (e.g. drag_x.out for the X axis). In all software versions since CNC7 v8.23 (ca. June 2004), the results are displayed graphically as soon as the test is finished.
In older CNC7 versions, after the test is complete, you have to press ESC four times to return to the main screen; press F2/Load; navigate to the C:\CNC7 directory; highlight the desired DRAG_?.OUT file; and press F8/Graph.
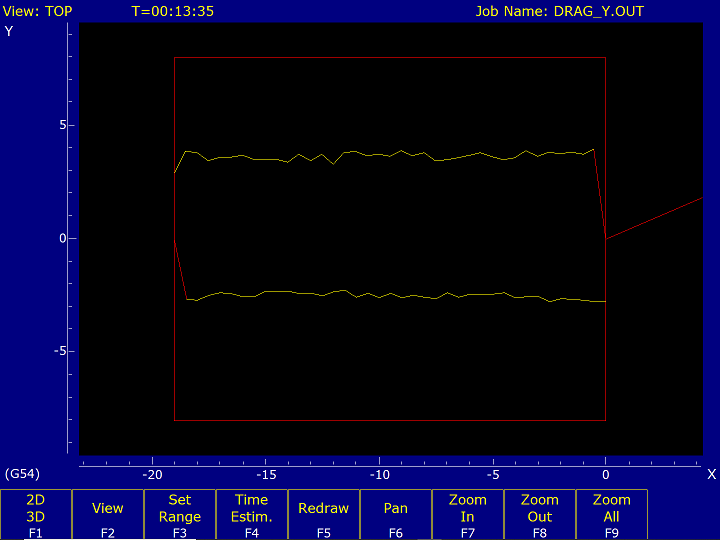
A typical drag plot for a well-behaved axis might look like this:

The horizontal axis represents machine position of the test axis (inches or mm). The vertical axis represents servo motor load or torque, on a scale of +/- 0 to 32. That is, 32 units corresponds to 100% of available servo torque.
The red box is at the recommended limits of plus and minus 25% torque (8 units). Centroid recommends that, if the servo motor is appropriately sized for the machine, it should not take more than 25% of available torque to move the axis at Slow Jog speed with no cutter load.
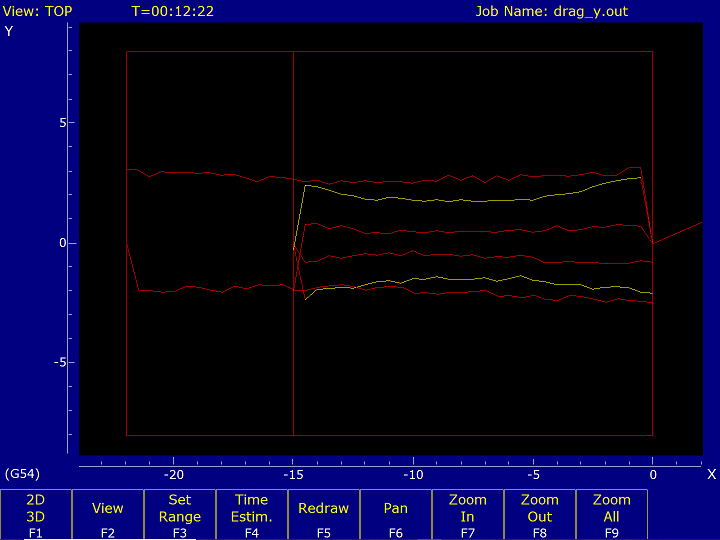
If the Drag Diagnostic is run multiple times on an axis, and the control software is CNC7 v8.23 (ca. June 2004) or newer, then the most recent run will be shown in yellow, and earlier runs will be shown in red, from newest to oldest. This allows you to monitor changes over time, and also to immediately review the effect of mechanical adjustments, such as tightening gibs or bearings.
The following is a drag plot from a machine that had its Y axis travel reduced for a custom fixture. The oldest results go out to -22"; the newer results stop at -15". In the first drag test after the travel reduction, motor load was considerably lower than when the machine was new. There was also over 0.005" slop in the gibs. The final (yellow) test results are from after the gibs were tightened back up.
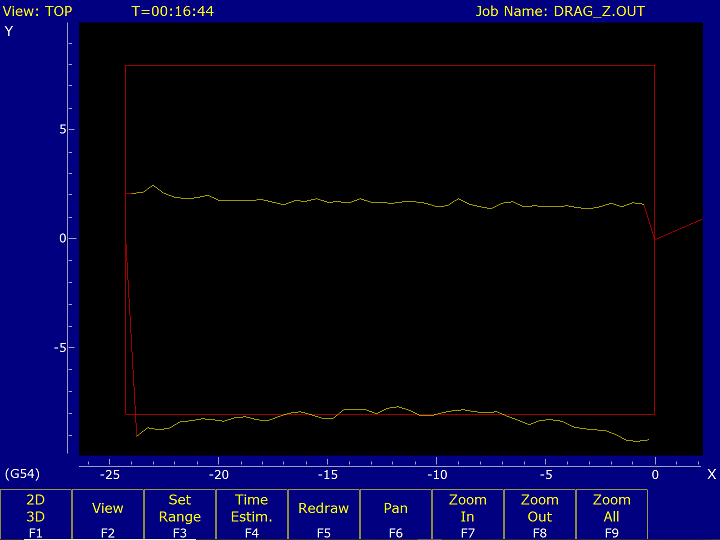
This test would have also displayed an "excessive axis drag" warning upon completion, because the lower trace (upward Z movement) runs outside the recommended 25% guidelines.
Beginning with CNC10 version 2.70, and continuing through CNC11 version 3.10, the drag test on torque-mode controls left the Kg gain in place, and so if Kg is adjusted properly, the graph will be centered, even if the axis is not balanced. To see actual servo load in these versions you must change Kg to zero while you run the test, then when you are done restore Kg to a value that results in a centered drag plot.
Beginning with CNC11 version 3.12, and continuing in all remaining CNC11 and CNC12 versions to date, the data source was changed (from the accumulated sum of errors, to the actual PID output) so the drag plot results once again accurately reflect any imbalance in the axis, regardless of Kg value.
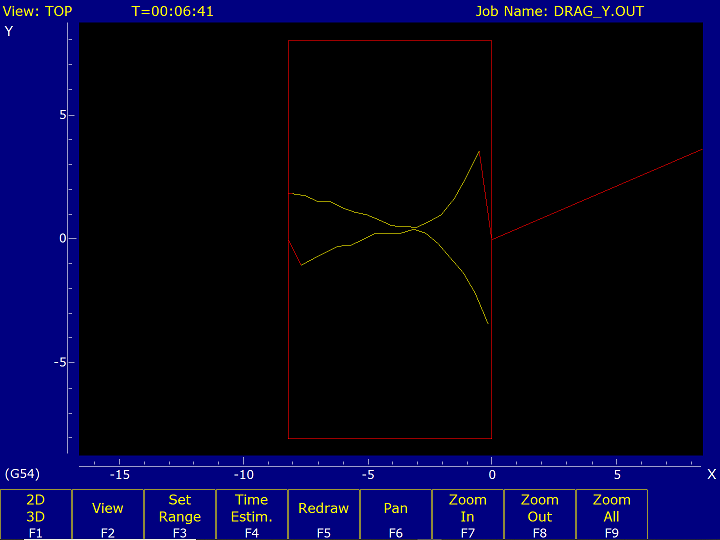
It is common for an axis to have higher drag at the ends of travel, and lower drag in the middle. This results in a drag plot with a "bowl" or "hourglass" profile. Causes can include:
The plot display uses the same graphic interface as the F8/Graph preview that you use with your CNC programs, on the main screen of the Centroid control software.
As such, it has the ability to pan, zoom, and place crosshairs on the screen.
You can use the crosshairs to make quantitative estimates of axis drag, and therefore better judge whether drag, or changes in drag, are significant.
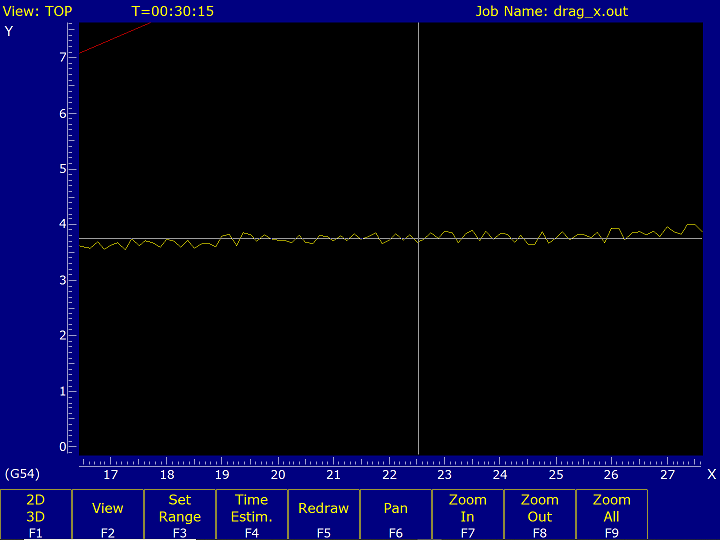
The drag_?.out files are included in a Report,
and can be viewed with the Offline/Demo version of the control software.
Copyright © 2025 Marc Leonard
Last updated 25-Mar-2025 MBL